

Consuming Japan

Winners' Circles (Visualizing Networks with Pajek)
Categories:
In this section, we begin to look at the network diagrams constructed by Pajek and how to read them.
Pajek, the program I use for network analysis and visualization, is a powerful piece of software. Only a handful of its features are used in this study. These have been selected because they are relatively simple to understand and provide quick answers to basic empirical questions.
Analysis generates numbers, measures of either structural properties of whole networks or sub-networks considered as wholes or of the nodes and edges for which these networks are composed. Visualization draws pictures of networks, creating the network diagrams that are the first thing likely to come to mind when networks are mentioned. We must not forget, however, that these diagrams are only suggestive; they may stimulate thinking and suggest insights, but for reasons that will soon be apparent prove nothing about the data they display. Images can be misleading and are even easier to manipulate that statistics.
Consider, for example, Figure 1, the complete Ad-Creator network for 1981.
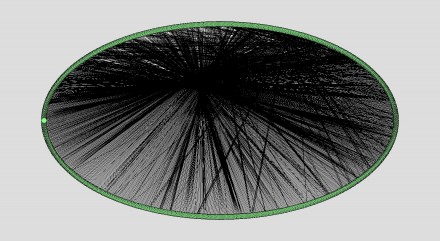
In this diagram, the network is displayed with the nodes (Ads or Creators) arranged in an oval and connected by a dense web of relationships, each one of which corresponds to a role connecting one Ad to one Creator.Yes, there are a lot of connections here, and the image suggests that all of the nodes are connected in one way or the other. This conclusion, however, is erroneous.
Figure 2 shows the same network; but now the network has been energized using the Fruchterman-Reingold algorithm that rearranges nodes in a way that separates unconnected parts of the network.
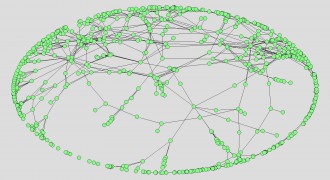
Now most of the nodes are spread around the oval on the outside, and only a relative handful are in the center where relationships connecting different segments of the oval intersect. Since, however, all of the nodes are of the same size and color, we see only the broadest outlines of the structure.
Figure 3 is the result of the Net>Partition> 2-mode command that creates a partition separating Ads and Creators and assigns different colors to them.
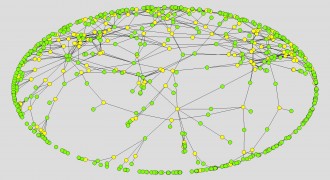
But this is only a bit more informative than Figure 2. Different partitions will tell us more. The Net>Components>Weak command creates a partition that divides the network into components, discrete subnetworks, such that members of any one subnetwork are connected with each other but not to members of any other component. Figure 4 shows the result of applying this command to the 1981 Ad-Creator network.
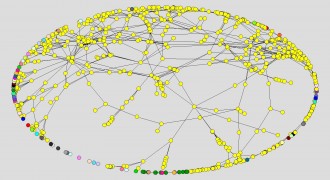
The colors correspond to a structural attribute, the node’s membership in one and only one component. In this diagram, the vast majority of nodes, the ones colored yellow, belong to a single giant component. This network contains a total of 73 components; but the rest are very small, a result consistent consistent with basic theorems in network analysis math (see “Components and Bicomponents”).
Suppose, however, that we take a look at other attributes, taken from our data instead of structural analysis. Figure 5 shows the network with the nodes colored to represent the agency that produced the Ad (Yellow=Dentsu, Green=Hakuhodo, Dark Blue=Other) and to differentiate the Creators (Light Blue=Creator) from the Ads.
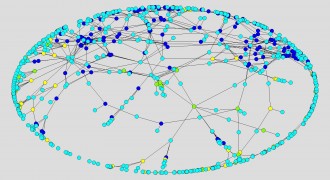
We may note how Ads produced by Hakuhodo (Green) dominate the center of the diagram where relationships connecting the whole intersect, and Ads produced by Other agencies (Dark Blue) far outnumber those produced by both Hakuhodo and Dentsu. Analysis of other networks will show that only the 1981 network exhibits these features.
Figure 6 shows the same network. Once gain Light Blue distinguishes the Creators from the Ads. But now the other colors correspond to media (Yellow=TV, Green=Radio, Pink=Newspapers, Red=Magazines).
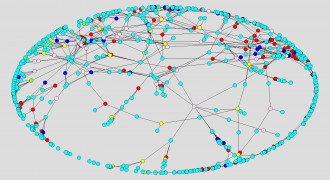
Here we observe that the number of TV commercials is relatively small and the number of magazine Ads large. And the cluster at the center of the diagram may be a print campaign, combining newspaper and magazine Ads but including no TV or radio. Again, analysis of other networks will show that only the 1981 network exhibits these features.
In later sections, we will employ other features of Pajek to enrich our visualizations of the networks we are studying. But when I say now that Pajek functions as a sociological macroscope (the functional equivalent of the biologist’s microscope), my meaning should be clear. Already we can see structures emerging, and like the biologist who stains his slides, we, too, can use color to highlight questions of interest. But we, too, must be careful when we draw conclusions from what we see. Visualization must be followed by analysis based on the numbers that Pajek generates for us as it creates network diagrams, and these in turn must be considered in light of the larger context from which those numbers are extracted.
Next entry: Winners' Circles (Analyzing Networks with Pajek)
Previous entry: Winners' Circles (Establishing the Context)