

: Statistics

So, you think you hate statistics
When I told our friend David Littleboy that I was having trouble understanding the statistics generated by my network analysis software, he recommended Andrew Vickers’ What is a p-Value Anyway? When I found it on Amazon, Amazon suggested that I might also want to purchase David Salsburg’s The Lady Tasting Tea. The title was irresistible. That is how I wound up buying two remarkable books. Both take on the task of humanizing statistics. They succeed in different ways.
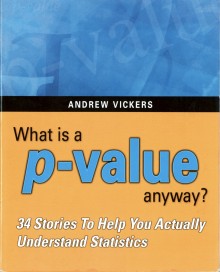
As its subtitle explains What is a p-Value Anyway? is a collection of 34 stories, each of which illustrates a particular point about statistics. The information is serious, but the tone is lighthearted.Each story begins with a cartoon. Thus, for example, Chapter 2 “So Bill Gates walks into a diner: On means and medians” begins with a cartoon showing a waitress asking, “How was your breakfast, Mr. Gates?” Gates replies, “About average,” raising the eyebrow of the statistician sitting on the next stool reading his Daily Stat. The opening paragraph reads, “A statistician’s joke: So Bill Gates walks into a diner?cand the average salary changes.” With Gates in the diner, the mean salary is hundreds of millions of dollars, far above the median, a more realistic estimate of what most people who frequent the diner make. Similar stories introduce describing data, data distributions, confidence intervals, hypothesis testing, regression and decision-making, and some common statistical errors. I am reminded of Salman Khan’s math videos. Here, too, a tough subject is introduced in small digestible bites.
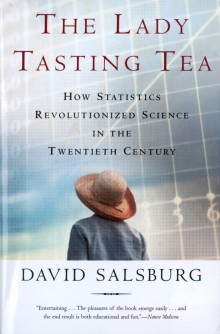
The Lady Tasting Tea also begins with a story. The opening sentences read,
“It was a summer afternoon in Cambridge, England, in the late 1920s. A group of university dons, their wives, and some guests were sitting around an outdoor table for afternoon tea. One of the women was insisting that tea tasted different depending upon whether the tea was poured into the milk or whether the milk was poured into the tea. The scientific minds among the men scoffed at this as sheer nonsense?c [Except for one, that is.] A thin, short man, with thick glasses and a Vandyke beard beginning to turn gray pounced on the problem.”
At the end of the chapter, we learn that the lady, when tested with a random series of cups mixed in different ways, got every one right.
The bearded man was Ronald Aylmer (R.A.) Fisher, whose 1935 book The Design of Experiments would revolutionize the way science was done. In The Lady Tasting Tea, we learn a lot about him, his career, his achievements, and his academic rivals?\and he is only one of many.The 29 chapters of The Lady Tasting Tea are devoted to the lives and careers of the statisticians who invented the techniques described in What is a p-Value Anyway? Many of them knew each other as teacher and student or as bitter rivals or both. The techniques are described in the context of the problems they were designed to solve and the quarrels they initiated.
Both The Lady Tasting Tea and What is a p-Value Anyway? succeed in bringing to statistics to life, one through historical drama, the other through self-deprecating comedy. Even if you already know the statistics you will find them delightful to read. If you don’t, you will learn a lot about statistics. You are also likely to enjoy the experience.
References
Andrew Vickers (2010) What is a p-Value Anyway? 34 Stories to Help You Actually Understand Statistics. New York: Addison-Wesley.
David Salsburg (2001) The Lady Tasting Tea: How Statistics Revolutionized Science in the Twentieth Century. New York: Henry Holt and Company.