

Consuming Japan

???\Japanese Weaknesses
Categories:
What do Japanese see as weaknesses, especially weaknesses in themselves? This is the question addressed in the September 2012 (Vol. 2) edition of ??????@?u????????????????z??[??[?v(Seikatsusha: A concept paper for people who create tomorrow), published by HILL, the Hakuhodo Institute of Life and Living. The lines at the bottom right of the cover suggest that we grasp the meaning of “weakness” by examining everyday life and then imagine the future starting from what we discover.
The first two spreads present comments from a dozen individuals interviewed for the project.
1. A single woman (26). She feels awkward in groups of women who are always and forever chatting. She would like to leave but knows that the relationships formed in such groups can be important for her future.
2. A self-employed barber, male (43), married with three sons. Digital technology makes him uncomfortable. His car has a digital navigation system, but he always has someone else look at it and tell him where to drive. Else, he prefers a paper map.
3. A married woman (43) with a husband and three sons would like to keep her house spic-and-span. It isn’t just that she doesn’t have the time or money, she never feels like doing the cleaning.
4. A man (41), who lives in an apartment with his wife, a college classmate, and their fith-grade son. Feels like a big third-grader who has never grown up. He has gotten older and fatter but doesn’t do what grownup men do, go to hostess bars, play golf, or gamble.
5. A single man (33). Finished graduate school and works as an IT consultant. Tried living by himself for a year but has moved back in with his mother and sister. He would like to be the cool guy who walks into a bar by himself and orders a drink, but he is too shy to strike up a conversation with strangers.
6. A woman (38), just got married last November (2011) after energetically pursuing a mate. She is wondering if she doesn’t dress too young for her age. Should she stop wearing short skirts? She still likes to dress like a single woman in her early 30s.
7. A man (63), retired, lives with his full-time housewife spouse. He feels like zero without his company and the co-workers with whom he used to pal around. He has no community in the neighborhood.
8. A single man (25). LIves with his parents, two sisters, and his grandmother in a six-person household. Finds it hard to converse with the people close to him but has no problem speaking up at work-related meetings organized by others.
9. A woman (17) in her third year of high school. Weak at math and wonders why she has to study it.
10. A man (50), a company employee who lives with his wife and two daughters. Feels like he doesn’t have the courage to stand up for what is right.
11. A woman (70). She ran her own beauty shop for more than 40 years and now does volunteer work, cutting the hair of elderly people in nursing care. But she was brought up with a clear set of does and don’ts. She loves sushi but is still too embarrassed to go into a sushi shop by herself.
12. A man (17), in his third year of high school. Sings in the chorus and belongs to the calligraphy club. He says that it is hard to explain but that he is very uncomfortable calling himself “ore” (a rough, masculine way of saying “me”). He never uses this term for himself.
As I read the comments from these twelve individuals, I am struck by how ordinary they seem to me. Have I lived in Japan for too long? Or am I right to think that we can find people everywhere who feel that they have these kinds of weaknesses?
TV+Smartphone=Marketer's Delight
Categories:
It’s a marketer’s dream scenario. The customer sees what you’re selling on TV, picks up her smartphone, buys it online or decides to go shopping and check it out.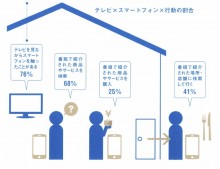
The October 1, 2012 issue of Senden Kaigi reports on a recent survey by the HakuhodoDY group’s Smart Device Business Center (smartphone users, MF, teens to 60s, n=1,000). According to this survey, 76% sometimes use smartphones while watching TV, 68% search for products and services advertised by the programs they watch, 25% purchase the products or services online, and 41% check them out at brick and mortar stores when they go shopping. Sounds like a great scenario from a marketer’s perspective?\but how often does this “sometimes” happen? Once in a blue moon? Or frequently? Inquiring minds want to know.
Yankee, Gal, Otaku and AKB48
Categories:
“Yankee” (yankii in Japanese) originally referred to fashions worn by young Japanese who took as their models off-duty U.S. servicemen encountered in the 1960s and 70s. In the 1980s the look was adopted by members of biker gangs called bososoku, for whom dark glasses, Hawaiian shirts, baggy shorts, girls’ sandals?\all the antithesis of the helmets and leathers recommended by motorcycle safety courses?\signaled outlaw bravado. The bikers, however, also adopted tokkofuku “suicide squad uniforms,” modeled on military uniforms worn on mass rides or in confrontations with other gangs (the name suggests those worn by kamikaze in WWII). Yankee styles are associated with lower-class, blue collar and temporary workers. Why then has the Avex Group, one of Japan’s largest talent management and entertainment companies, been using the Yahoo!Japan top page to advertise auditions for yankiitsupparibishojo (Yankee punk beautiful young girls)?
That is the question with which a special session devoted to “Japan’s unique mass markets: Yankee, Gals, and Otaku” (Senden Kaigi, No. 845, September 15, 2012) begins. Ryoji Aoki, the manager in charge of the project explains,
This project has been brewing for three years. The girls who became idols were usually straight, orthodox types. That left Yankees an untouched market. While preparing for the auditions, we conducted market research among Yankee girls living in the northern Kanto. We found that in Japan that there are still those that want to be “bad.” Recently we have seen the emergence of the oraora “bad-bad” style, a blend of gyaru “gal” (heavily made up and outrageously costumed) and the original Yankee style. In it we saw a foreshadowing of a full blown revival of the Yankee style that flourished in the 1980s.
To Aoki, the ideal image of a Yankee idol includes a military uniform or jumpsuit and a lavishly decorated car, in a blend of classic Yankee and modern idol taste. Seen from abroad as a kind of “cosplay” (costume play), the Yankee idol would be perceived as cool. The new girl group’s fans would include boys with the same oraora tastes, otaku deeply immersed in Akihabara culture, and “light otaku,” young men who may not at first glance appear to be otaku. Otaku and Yankee might appear to be opposite types [one passive, the other aggressive; one middle class, the other lower class], but they have much in common says Aoki.
The Avex Group aren’t the only ones interested in Yankees. The HakuhodoDY group has conducted its own research, using a sample of 800 men and women who are either former Yankees or former Gals, now aged 20-39. The sample was chosen from those who, when shown illustrations of typical figures representing the two subcultures, selected them as “close to what they themselves had looked like in high school.” The survey covered attitudes toward friends and family, information sources and media contact, and consumption trends. Results included closer than average attachment to people in the neighborhoods where they grew up and live and longer than average time spent watching television, but far less use of social networking sites (SNS). More than 60% say that they spend money when they have it and, while they have to scrimp and save, will spend on drinking and other treats.
Of particular interest is the emerging category of “Gal mamas,” who are now catered to by their own magazines. Marrying younger and having children sooner than other Japanese women, these former Gals are an attractive target for baby care, toy and other industries who have seen markets slump due to Japan’s low birth rate.
The special section includes a discussion by Koji Nanba (KN) and Satoshi Hamano (SH). Nanba is a sociologist and university professor who studies youth subcultures and the author of Yankii shinkaron (Yankee Evolution, Kobunsha, 2009). Hamano is a columnist for the Asahi Shimbun newspaper and the author of Aakitekuchanoseitaikei (The Ecology of Architecture, NTT, 2008) and AKB48 hakunetsuronso (The White Hot Debate about AKB48, Kobunsha, 2011). The following passages are selected and adapted from this discussion.
Yankees make up 20% of fans at AKB48 meet and greet events
Editor: Marketers tell us that we should pay attention to Yankee, but they find it difficult to create a convincing image of them as consumers.
KN: Most people who work in advertising or media are from white collar backgrounds. Without direct experience, they have a hard time coming up with a realistic image.
SH: You are talking about people like me who have never experienced the Yankee subculture.
KN: The music and dance group EXILE has been a major factor in the renewed interest in Yankee. There aren’t many people who call themselves Yankee. But there can be no question about it that Yankee taste has become a major phenomenon.
SH: Yankee taste is part of the background to the success of AKB48 as well as EXILE. At events where fans get to meet AKB48 members, 20% of those who show up are Yankees. They come with the names of their favorite members of the group stitched to their uniforms.
KN: They seem to be imitating the bodyguard/ardent fan style from the 1980s. We thought the era of Yankee chasing after their favorite celebrities was over, but the new idol boom appears to have stimulated a Yankee resurgence.
SH: There is also the Majisukagakuen series on TBS, in which AKB48 members appear as Yankee characters, who fight, hit and scream at each other. (The third season is currently being broadcast from July to October.)
SH: Of those who show up at AKB48 events, only 10-20% are classic idol-otaku (men with an obsessive interest in their idols). Another 20% are women in their teens or early 20s. The overwhelming majority are high school or college boys, including those who play at being bad boys.
Editors: In the HakuhodoDY survey, AKB is the seventh most popular group among former Yankees and former Gals. They rank only number nine among ordinary subjects in the same age band.
KN: AKB48 may be why we see Yankee becoming involved with idols again.
White collar stagnation casts spotlight on determination to survive.
Editor: Yankee and otaku are sometimes seen as polar opposites. How has each type changed?
KN: In most cases the Yankee characters depicted in recent manga and movies have serious, practical issues to confront. In the video series,“Saitama Rapper,” things don’t turn out too badly in first two episodes, but the third and last episode is grim.
SH: In the manga series Yamigane Washijima-kun (Yamigane can be literally translated “Dark Money) has been made into a movie that typifies this “dark Yankee” trend. In it AKB48 member Oshima Yuko appears as the freeter (casual worker) heroine.
SH: To me these films reflect the effects of the recession and the recognition that hoowever hard the work, you have to do it to survive. When Japan seemed to be a “100 million middle class” country, everyone wanted to escape from blue collar lifestyles. White collar stagnation has made Yankee, the most visible blue collar subculture, attractive again.
KN: From a university professor’s perspective,you can’t help feeling the youthful strength and energy it he way that Yankee characters are depicted. Nowadays, university graduates without specialized skills, especially those with degrees in the humanities, get assigned to sales in the companies at hire them. But those with Yankee tendencies are likely to be better salespeople.
SH: The more I read your book Yankee Evolution, the more I am persuaded of the similarities between Yankee and otaku. Both have adopted bits of foreign culture but transformed them in a Japanese Galapagos way. Most Japanese manga and anime have their roots in SF or Disney.
KN: Yankee fashion is a mixture of the styles worn by off-duty American GIs in the 1960s and 70s with Japanese outlaw culture.
Desire to live real life to the full and school castes set the stage
Editor: How is Yankee consumption behavior changing?
SH: The earlier versions were fundamentalists or serious avant-garde. The ones we have seen since 200 are “otaku lite.” The AKB48 fans belong to this category.
KN: We no longer see those who are absolutely committed to their Yankee identity. I remember from a previous interview your using the expression “tagging” to describe what has happened.
SH: It used to be that Yankee embodied a strong lower class consciousness. Otaku were also clearly defined as the unpopular ones by school caste systems. Now otaku lite are coming out of their shells and looking for something fulfilling in real life. As media coverage of Yankee items has risen, it has become increasingly possible for otaku to think that simply purchasing certain items is the key to acceptance as one of the gang.
Consumption for the sake of relationship. Even otaku can belong to the gang.
SH: AKB48 illustrates how otaku turn out for concerts and chances to meet their idols. Genbashugi (an ideological committment to “being there”) makes participation in events and buying memorabilia part of who they are.
KN: The otaku lite are really different from the classic otaku who stays home watching anime all the time.
SH: They want to have a relationship, to be part of a group. Dentsu is now promoting its SIPS (Sympathize, Identify, Participate, Share and Spread) model for understanding social media. At the core of the SIPS process are relationships created by “chasing what is interesting” or “being bad.” One good example an Ezaki Glico confectionary campaign in which parts of faces from different AKB48 members are mixed to create a portrait of the ideal AKB48 girl.
KN: Whether Yankee or otaku, fans of the same idols have something in common that creates a relationship and makes communication possible. Adding a Yankee flavor to AKB48 is sure to boost their popularity.
Reading this discussion, I find myself thinking about kachigumi (winners) versus makigumi (losers), a classification that reflects the growing class polarization of Japanese society. Taking pride in being a bad ass is not a bad way to maintain self-esteem if opportunities to get ahead and escape from a life of repetitive office or physical labor are increasingly scarce. And it’s not, of course, an option restricted to young Japanese.
Dogû, a Cosmos
Categories:
“Dogû” is a Japanese term literally translatable as “clay figurines.” The following text is from the flyer advertising Dogû, a Cosmos, an exhibition at the Miho Museum in Shigaraki, Japan. 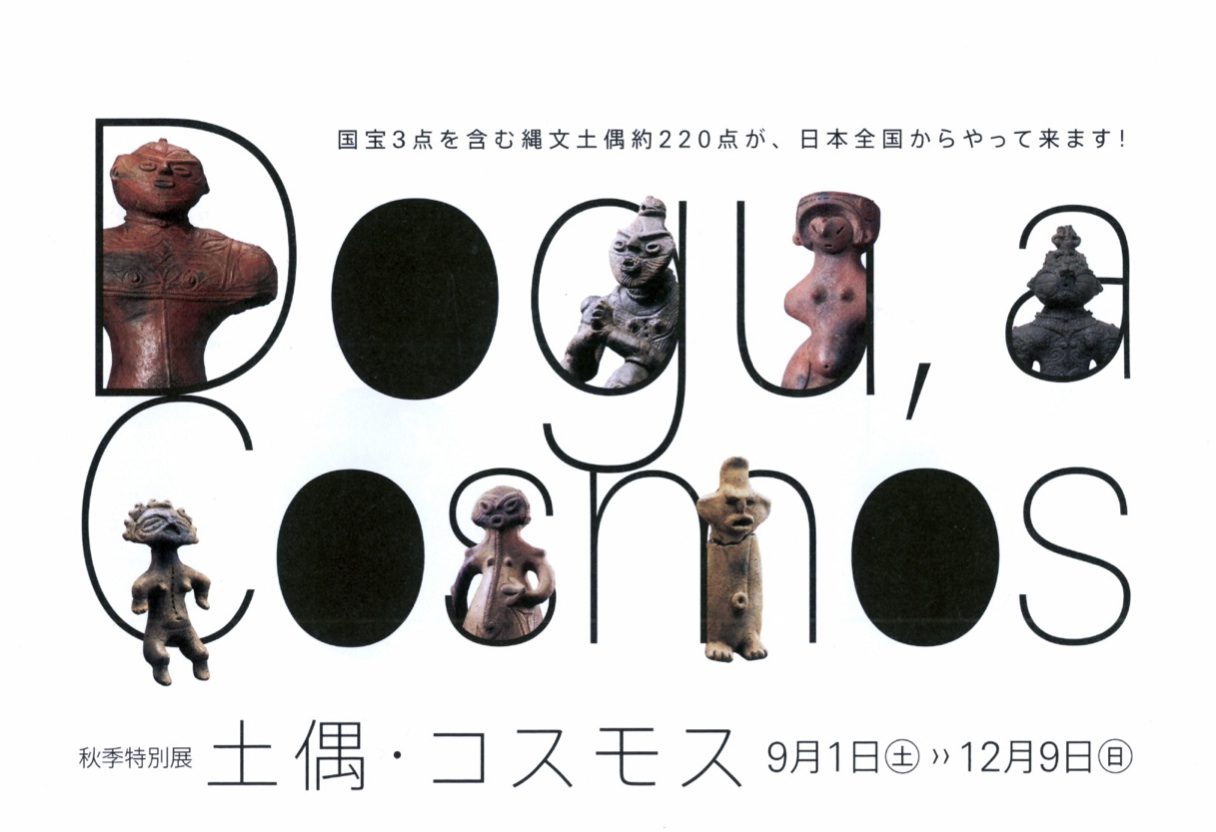
The Jomon period had just begun when people began making small figurines of clay. Were there real women whose bodies were this surprisingly curvaceous? At first, the figurines had no heads or hands or feet. Sometimes the entire lower half of the body was missing. They were tiny, precious treasures, small enough to hide in the palm of your hand. Over the next several thousand years, the figurines acquired heads and hands and feet. The “Jomon Venus” (designated a National Treasure) was born. Her face is heart shaped, her hair style exotic. The exaggerated breadth of her hips is striking. She was carefully buried in the center of a village. Was she buried to accompany the dead? Or worshipped as a goddess?
Another several thousand years passed. Now “goggle-eyed” figurines were painted with gorgeous colors.
During the more than ten thousand years of the Jomon period, these clay figurines were produced throughout Japan. For this exhibition, examples from Hokkaido to Kyushu have been brought together here in Shigaraki. In their powerful presence, you can see the roots of the Japanese people.
Winners' Circles (Analyzing Networks with Pajek)
Categories:
There is more to social network analysis than visualizing networks. This section provides a brief overview of the analytic tools that Pajek provides and how to read the tables these tools generate.
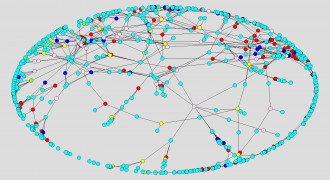
In the previous section, we saw how adding visual information to network diagrams highlights structures and points to questions of interest. But as all network analysts know, adding too much information can make a network incomprehensible. Figure 7 is a case in point.
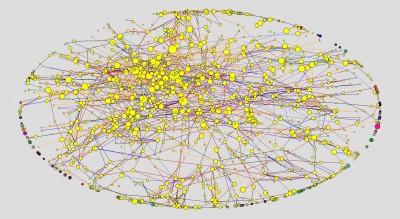
Here the network in question is from 2006, a year in which 2,662 creators participated in creating 808 winning ads. The colors distinguish Ads (Yellow) from Creators (Green). The sizes of the nodes indicate the number of edges connecting each node to its immediate neighbors. The colors of the lines indicate the roles that connect individual creators to the ads on which they worked. The result is unintelligible to the human eye.
The inability of the human eye to parse large and richly coded networks means that, for practical purposes, most empirical network analysis becomes either computational, using software to crunch numbers and pondering the results, or requires dissection of large networks into subnetworks. In practice, these two approaches are frequently combined, and Pajek provides numerous tools for these purposes. Using Pajek, we can
find clusters (components, neighbourhoods of ?eimportant’ vertices, cores, etc.) in a network, extract vertices that belong to the same clusters and show them separately, possibly with the parts of the context (detailed local view), shrink vertices in clusters and show relations among clusters (global view).(Bataglej, 2008:8)
At the same time, we can use the Info command to examine the numbers generated by Pajek during these and other operations. Continuing, then, with Ads-Creators 2006, the network illustrated in Figure 7, we begin with Info>Network>General. In the Info report window we see the following table.
Number of vertices (n): 3469
——————————————————————————-
Arcs Edges
——————————————————————————-
Number of lines with value=1 0 1079
Number of lines with value#1 0 6195
——————————————————————————-
Total number of lines 0 7274
——————————————————————————-
Number of loops 0 0
Number of multiple lines 0 1102
——————————————————————————-
Density1 [loops allowed] = 0.0012089
Density2 [no loops allowed] = 0.0012093
Average Degree = 4.1937158
2-Mode Network: Rows=808, Cols=2661
Density [2-Mode] = 0.0033831
Reading from the top, we see that the network contains a total of 3469 nodes (here called vertices). If this were a directed network, we would have to distinguish between Arcs and Edges. In this network, however, there are no Arcs. All of the lines are undirected Edges and represent relations in which the relationship between node A and node B is the same as that between node B and node A.
In the next block we see that the number of lines with value equal to 1 is 1079, while the number of lines with value not equal to 1 is 6195. Here, however, we have to be careful. The ways in which Pajek presents numbers like these are very general and highly abstract. Pajek only reports the results of calculations without differentiating what these numbers might mean. In some cases, the numbers of lines equal or not equal to one are structural properties resulting from calculations. Here, however, the numbers are assigned codes that indicate the roles that connect Creators to Ads (1=Copywriter, 2=Creative Director, 3=Art Director, 4=Designer, 5=Photographer, 6=Planner, 7=Producer, 8=Film Director, 9=Cameraman, and 99=Other). The numbers are, in other words, only labels in classification; they correspond to the line colors that appear in the network diagram and can be used to select particular sets of lines. They should not, however, be used in calculations.
The next two blocks tell us that the total number of lines is 7,274, of which 1,102 are multiple lines. These numbers are significant, since they tell us that some pairs of nodes are connected more than once (in this case because the same creator may play multiple roles in the team that produces an ad) and allow us to calculate that, in this case, 15.1% of creators have played multiple roles. The number of loops, edges that connect a node to itself, is 0. This is an artifact of our data, a 2-mode (bipartite) network in which which a node of one type can only be connected to a second node of the other type (Ads to Creators or vice-versa).
The next set of numbers provide us with two common measures of network structure: Density and Degree. Density is the percentage of edges found in the data when compared to the total number of possible edges (n(n-1)/2) in a network with n nodes). As a result, Density tends to decline as network size increases. Degree, the number of neighboring nodes directly connected to the the node in question, is a more informative measure. The 4.1937158 reported here could, however, be misleading. It tells us that, on average, every node in this 2-mode network is connected on average to between 4 and 5 nodes of the opposite type. It does not tell us either the average number of creators involved in producing an ad or the average number of ads produced by a single creator. To discover these facts requires further analysis.
The last set of numbers tells us that, if this 2-mode network were represented by a matrix, the matrix would have 808 rows and 2661 columns. For mathematical purposes, networks are often represented as matrixes and methods from matrix algebra are used to analyze them. Here the rows are Ads, the columns Creators, and a non-zero number in a cell where a row and a column intersect indicates that there is a relationship between the Ad and Creator in question. In this case, the commands Net>Partition>2-mode and Info>Partition produce the following table.
Dimension: 3469
The lowest value: 1
The highest value: 2
Frequency distribution of cluster values:
Cluster Freq Freq% CumFreq CumFreq% Representative
———————————————————————————————-
1 808 23.2920 808 23.2920 AD1_06
2 2661 76.7080 3469 100.0000 Yam342
———————————————————————————————-
Sum 3469 100.0000
Here we find little that we do not already know. The table tells us that we are looking at partition that divides the total network into two clusters labeled 1 and 2 of which the first contains 808 members, the second 2661. Since these are the Ads and Creators, there is nothing new for us here. Digging a bit deeper, we find that yellow and green are the default colors that Pajek assigns to clusters numbered 1 and 2. We also note the column headers: Freq=frequency; Freq%=percentage of total; CumFreq=Cumulative Frequency; CumFreq%=cumulative percentage of total; and Representative is simply an identifier for a typical example of the cluster. With only two clusters to worry about, this may seem a lot of bother for no great reward. Suppose, however, that we change the partition by using Net>Partition>Degree>All and Info>Partition. Now the table that appears is the following
Dimension: 3469
The lowest value: 1
The highest value: 60
Frequency distribution of cluster values:
Cluster Freq Freq% CumFreq CumFreq% Representative
———————————————————————————————-
1 1261 36.3505 1261 36.3505 Tan1892
2 623 17.9591 1884 54.3096 AD760_06
3 255 7.3508 2139 61.6604 AD83_06
4 277 7.9850 2416 69.6454 AD103_06
5 229 6.6013 2645 76.2468 AD5_06
6 183 5.2753 2828 81.5221 AD67_06
7 99 2.8538 2927 84.3759 AD38_06
8 104 2.9980 3031 87.3739 AD76_06
9 76 2.1908 3107 89.5647 AD60_06
10 54 1.5566 3161 91.1214 AD43_06
11 39 1.1242 3200 92.2456 AD104_06
12 50 1.4413 3250 93.6869 AD1_06
13 32 0.9225 3282 94.6094 AD22_06
14 21 0.6054 3303 95.2148 AD65_06
15 27 0.7783 3330 95.9931 AD15_06
16 16 0.4612 3346 96.4543 AD13_06
17 25 0.7207 3371 97.1750 AD80_06
18 16 0.4612 3387 97.6362 AD19_06
19 12 0.3459 3399 97.9821 AD37_06
20 17 0.4901 3416 98.4722 AD73_06
21 7 0.2018 3423 98.6740 AD75_06
22 3 0.0865 3426 98.7604 AD450_06
23 5 0.1441 3431 98.9046 AD366_06
24 6 0.1730 3437 99.0775 AD195_06
25 6 0.1730 3443 99.2505 AD210_06
26 3 0.0865 3446 99.3370 Ich674
27 1 0.0288 3447 99.3658 Sas1520
28 4 0.1153 3451 99.4811 AD448_06
29 1 0.0288 3452 99.5099 Ter536
31 6 0.1730 3458 99.6829 AD315_06
32 1 0.0288 3459 99.7117 Yam342
34 5 0.1441 3464 99.8559 AD311_06
39 1 0.0288 3465 99.8847 Soe903
42 1 0.0288 3466 99.9135 Oka258
49 2 0.0577 3468 99.9712 Sas3
60 1 0.0288 3469 100.0000 Saw8
———————————————————————————————-
Sum 3469 100.0000
Here we learn that Degree, the number of immediate neighbors of nodes, ranges from 1 to 60. We may also note that the Representative nodes for the top four numbers are all Creators instead of Ads. We may also note the highly skewed distribution of degrees, from 1,261 nodes with only one immediate neighbor to only 1 node with 60 immediate neighbors. What could these observations means?
The commands that generated the Degree partition also created a Degree vector. We have already noted that the cluster numbers in partitions are only labels for discrete categories. These can be handy for extracting subnetworks of nodes belonging to those categories but cannot, being only labels, be used in calculations. The numbers in vectors are real numbers (pun intended). They can be used in calculations. If we have already used Net>Partition>Degree>All as indicated above, Info>Vector produces the following table
Dimension: 3469
The lowest value: 0.0003
The highest value: 0.0173
——————————————————————-
Sum (all values): 4.1949
Arithmetic mean: 0.0012
Median: 0.0006
Standard deviation: 0.0014
2.5% Quantile: 0.0003
5.0% Quantile: 0.0003
95.0% Quantile: 0.0040
97.5% Quantile: 0.0052
Vector Values Frequency Freq% CumFreq CumFreq%
——————————————————————————————————————————
( ... 0.000] 1261 36.3505 1261 36.3505
( 0.000 ... 0.006] 2155 62.1216 3416 98.4722
( 0.006 ... 0.012] 49 1.4125 3465 99.8847
( 0.012 ... 0.017] 4 0.1153 3469 100.0000
——————————————————————————————————————————
Total 3469 100.0000
Here we find the kinds of numbers used in statistical analysis: the range, mean, median, standard deviation, and the points one, two, three and four standard deviations from the mean. In the table the label of on the label on the leftmost column has changed from “Cluster” to “Vector Values,” and the numbers in the leftmost column have changed from integers used as labels to ranges defined in terms of real numbers.
In this section, we have learned that Pajek can be used to dissect as well as analyze whole networks and begun to get a sense of how to think about the numbers that Pajek generates the diagrams with which we begin our explorations of our primary data: the 2-mode networks in which the members of winning teams and the ads they created are nodes and the roles that linked creators to ads the ties that connect them.
Winners' Circles (Visualizing Networks with Pajek)
Categories:
In this section, we begin to look at the network diagrams constructed by Pajek and how to read them.
Pajek, the program I use for network analysis and visualization, is a powerful piece of software. Only a handful of its features are used in this study. These have been selected because they are relatively simple to understand and provide quick answers to basic empirical questions.
Analysis generates numbers, measures of either structural properties of whole networks or sub-networks considered as wholes or of the nodes and edges for which these networks are composed. Visualization draws pictures of networks, creating the network diagrams that are the first thing likely to come to mind when networks are mentioned. We must not forget, however, that these diagrams are only suggestive; they may stimulate thinking and suggest insights, but for reasons that will soon be apparent prove nothing about the data they display. Images can be misleading and are even easier to manipulate that statistics.
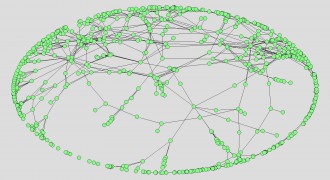
Consider, for example, Figure 1, the complete Ad-Creator network for 1981.
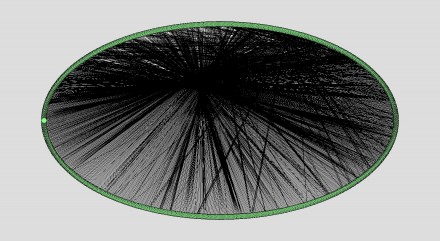
In this diagram, the network is displayed with the nodes (Ads or Creators) arranged in an oval and connected by a dense web of relationships, each one of which corresponds to a role connecting one Ad to one Creator.Yes, there are a lot of connections here, and the image suggests that all of the nodes are connected in one way or the other. This conclusion, however, is erroneous.
Figure 2 shows the same network; but now the network has been energized using the Fruchterman-Reingold algorithm that rearranges nodes in a way that separates unconnected parts of the network.
Now most of the nodes are spread around the oval on the outside, and only a relative handful are in the center where relationships connecting different segments of the oval intersect. Since, however, all of the nodes are of the same size and color, we see only the broadest outlines of the structure.
Figure 3 is the result of the Net>Partition> 2-mode command that creates a partition separating Ads and Creators and assigns different colors to them.
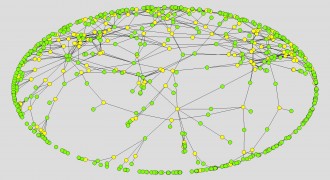
But this is only a bit more informative than Figure 2. Different partitions will tell us more. The Net>Components>Weak command creates a partition that divides the network into components, discrete subnetworks, such that members of any one subnetwork are connected with each other but not to members of any other component. Figure 4 shows the result of applying this command to the 1981 Ad-Creator network.
The colors correspond to a structural attribute, the node’s membership in one and only one component. In this diagram, the vast majority of nodes, the ones colored yellow, belong to a single giant component. This network contains a total of 73 components; but the rest are very small, a result consistent consistent with basic theorems in network analysis math (see “Components and Bicomponents”).
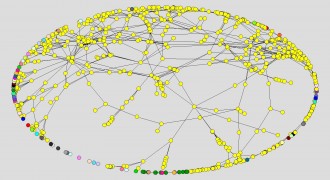
Suppose, however, that we take a look at other attributes, taken from our data instead of structural analysis. Figure 5 shows the network with the nodes colored to represent the agency that produced the Ad (Yellow=Dentsu, Green=Hakuhodo, Dark Blue=Other) and to differentiate the Creators (Light Blue=Creator) from the Ads.
We may note how Ads produced by Hakuhodo (Green) dominate the center of the diagram where relationships connecting the whole intersect, and Ads produced by Other agencies (Dark Blue) far outnumber those produced by both Hakuhodo and Dentsu. Analysis of other networks will show that only the 1981 network exhibits these features.
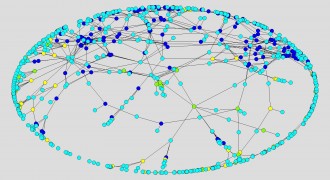
Figure 6 shows the same network. Once gain Light Blue distinguishes the Creators from the Ads. But now the other colors correspond to media (Yellow=TV, Green=Radio, Pink=Newspapers, Red=Magazines).
Here we observe that the number of TV commercials is relatively small and the number of magazine Ads large. And the cluster at the center of the diagram may be a print campaign, combining newspaper and magazine Ads but including no TV or radio. Again, analysis of other networks will show that only the 1981 network exhibits these features.
In later sections, we will employ other features of Pajek to enrich our visualizations of the networks we are studying. But when I say now that Pajek functions as a sociological macroscope (the functional equivalent of the biologist’s microscope), my meaning should be clear. Already we can see structures emerging, and like the biologist who stains his slides, we, too, can use color to highlight questions of interest. But we, too, must be careful when we draw conclusions from what we see. Visualization must be followed by analysis based on the numbers that Pajek generates for us as it creates network diagrams, and these in turn must be considered in light of the larger context from which those numbers are extracted.
Winners' Circles (Establishing the Context)
Categories:
We have reached the point where I turn from preliminaries, the personal and intellectual background, to the substance of the study. This section lays out some basic facts and key ideas that will later be developed in greater detail.
Our database contains a wealth of information. Filemaker Pro and Pajek make it easy to analyze and visualize that information. But seeing numbers and graphs is only a step toward understanding. To extract from numbers and graphs what they have to tell us we first have to grasp the context to which they refer. Here that means starting out knowing a few things about the Japanese advertising business and the processes by which the ads it produces are created.
We have already seen that the advertising industry in Japan is oligopolistic, dominated by three large agencies: Dentsu, Hakuhodo, and ADK. The smallest of the three, ADK, is also a newcomer, formed by a merger of two smaller agencies Asatsu Inc. (founded in 1956) and Daiichi-Kikaku (founded in 1951) on January 1, 1999. Thus, ADK does not appear in our data until 2001. From 1981 to 1996, our Agency attribute refers only to Dentsu, Hakuhodo, and Other.
As in other parts of the world, Japanese advertising agencies started out as media brokers, buying and selling space in print media: newspapers and magazines. With the advent of broadcast media, radio and TV, they moved into buying and selling insertions, time slots for commercials as well. Today, full-service agencies like Dentsu, Hakuhodo, and ADK also sell outdoor, in-store, transit (bus, train and taxi) and Web-based interactive advertising. Japanese advertising statistics typically draw a distinction between the big-four, newspaper, magazine, TV and radio advertising, and other advertising in other media, which historically accounted for relatively small shares of advertising budgets dominated by newspapers and TV. The importance of commuter train and subway travel gives posters displayed in the halls of train and subway stations a special importance in Japanese advertising. Their high proportion of winning ads that appear in the TCC annual may, however, owe more to the fact that posters are a highly visible way for advertising creatives to showcase their talents than to the relatively modest income streams that they generate for agencies.
Be that as it may, the critical facts for network analysts to consider are, first, that ads are produced by teams whose members are by definitions cliques, subnetworks in which every member is directly connected to every other and, second, that, as judged by the the number of individuals given credits in the TCC annual, the teams that produce TV commercials tend to be twice as large as those that produce print, newspaper or magazine ads.
It will come as no surprise to those familiar with combinatorics that, if a team with n members is a clique that involves n(n-1)/2 relationships, the subnetworks of creators involved with TV tend to expand more rapidly and to larger size than those of creators involved with print. This becomes an important consideration since over the period analyzed here the proportion of TV commercials included among the winning ads increases from 1981 to 2001, while the proportion of print ads declines.
It is also important to consider the composition of teams. The TCC annual credits include members of both the presentation and production teams. As their names suggest, the presentation team is the group whose members come up with the idea that is sold to the client. The production team adds individuals with the specialized skills required to produce the ad.
For a print ad, the presentation team would normally include a copywriter, creative director, art director and designer. If the idea chosen by the client involves a photograph, a photographer is added to the production team. If the photograph involves models, a stylist and a hair and make-up artist (if models are used) will also be added. Alternatively, if the idea chosen by the client involves an illustration, the illustrator replaces all three.
Production teams for TV commercials are normally much larger than those for print ads. The cameraman replaces the photographer. A producer and director organize and direct the shoot. In addition to the stylist and hair and makeup artist, there are those who edit the film and those who provide and mix the music.
These descriptions are, moreover, only sketches of what may be more complicated realities, with single individuals given credit for multiple roles and multiple individuals given credit for the same role. As previously mentioned, these complexities affect the structure of the database. They must also be taken into account in analyzing and interpreting the networks and subnetworks explored in this study?\ and they are just the beginning.
Much of the inspiration for the analysis offered in this study comes from Maki Jun, ed. (2006) Hitotsu ue no chiimu (Better Teams), a collection of essays in which nineteen of Japan’s most successful advertising creatives reflect on how team members work together to create great advertising. Maki, who was until his untimely death in 2009, one of Japan’s most famous copywriters, leads off with three introductions.
In the first he suggests that while there is no end of analyses of how organizations work, most have been focused on one of two topics: leaders or human resources. Most have assumed a military model, with the focus on the successful general or CEO’s personality and strategic thinking or, alternatively, on the recruitment, training and use of the troops or employees under his command. The latter are assumed to be interchangeable. Teams, however, don’t fit these models. Maki observes that in Japanese the English word “team” can be read te-amu (literally “to knit”). At the end of this introduction, he invites the reader to imagine a baseball player holding a bat. His ten fingers are knit together. Each has its own function. If properly positioned, they can, together, hit a home run.
In his second introduction, Maki engages in another bit of wordplay, suggesting the substitution of koshiki (a group of individuals) for the usual soshiki (total/solidary group) used to talk about organizations. Here he shifts his focus from the team as a collection of individuals with different skill sets to the team as a set of personalities, individuals who bring not only skills but their own ideas and feelings to the group.
That sets the stage for the third introduction, which addresses an issue well known to everyone who works in advertising. Teams are arenas where personalities clash. If they don’t, the work is likely to be dull. If the fighting becomes too bitter, the work may not get done. The art of the team leader is to manage this tension and exploit it.
Winners' Circles (Network and Other Perspectives)
Categories:
We are almost there. This section is the last of the preliminaries before we start digging into the data. Its purpose is to suggest what social network analysis brings to the table that those engaged in other forms of social science research might want to consider.
In the years after WWII, empirical social science, especially but not exclusively in North America, came to be dominated by what Andrew Abbott has labeled Standard Causal Analysis (SCA; Abbott, 2004). Social network analysis (SNA) was one of the intellectual movements, others including the interpretive turn in anthropology and other forms of postmodernism, that rejected its fundamental assumptions about the nature of human society.
Pragmatically, SCA aimed to identify the levers required by social engineering. Conceptually, it saw society as the outcome of forces operating in a way fundamentally similar to those envisioned by physicists in classical mechanics. These forces impinged on human objects (individuals or groups), and compelled them to move in particular directions. It was imagined, for example, that a particular combination of forces labeled “race,” “gender,” and “income” would necessarily determine the direction of a woman’s life. Those who objected to that direction could, then, alter it by changing one or more of the forces in question.
The problem was how to identify the forces and measure the weight with which they impinged on the human object. The favored method was a large-N statistical analysis of randomly sampled data whose output is epitomized by regression lines, i.e. vectors,a.k.a., directions, straight lines from point A to point B, constructed by optimizing the weightings of the forces (other vectors) supposed to impinge upon them. Since the subjects who answered the survey questions were usually individuals, this method was also highly compatible with envisioning an ideal outcome in which democracy (votes by individuals) and market forces (consumer choices by individuals) would aggregate to form the forces that would, via negative feedback, keep that society in stable equilibrium.
As critics never tire of pointing out, however, this approach not only ignores the agency, the human freedom to choose, of those whose behavior is shaped by the forces in question. Reality is messy and the results of research conducted along these lines tend to be neither clean nor pretty. The heart of the critique is captured in the quote with which Lin Freeman begins his history of social network analysis. Attributed to Columbia sociologist Alan Barton and written in 1968, it reads as follows.
For the last thirty years, empirical social research has been dominated by the sample survey. But as usually practiced, using random sampling of individuals, the survey is a sociological meat grinder, tearing the individual from his social context and guaranteeing that nobody in the study interacts with anyone else in it. It is a little like a biologist putting his experimental animals through a hamburger machine and looking at every hundredth cell through a microscope; anatomy and physiology get lost, structure and function disappear, and one is left with cell biology…If our aim is to understand people’s behavior rather than simply to record it, we want to know about primary groups, neighborhoods, organizations, social circles, and communities; about interaction, communication, role expectations, and social control. (Freeman, 2004:1)
Without the sociological turn to which Barton points in his conclusion, we are left with trying to understand what goes on inside the human cells of the social organism. When that is conceived in terms of subjective feeling, meaning and choice, we are left with either the speculations of consumer research or, in academia, the interpretive/postmodern alternatives previously mentioned above. With that sociological turn, however, the way remains open for scientific research that is not necessarily constrained by SCA assumptions. Social network analysis is one prime example; agent-based modeling may be another. Classical forms of ethnography and history, which balance interpretation from the subject’s point of view with material conditions, also have much to contribute.
What is it exactly, however, that social network analysis brings to the table? According to Freeman, social network analysis is a combination of
1. Structural intuition based on ties linking social actors
2. Systematic empirical data
3. Graphic imagery, and
4. Use of mathematical and computational models. (Freeman, 2004:3)
In this study, the structural intuitions that motivate the research are derived from a common sense representation of the Japanese advertising industry as a range of mountains, three very large and others smaller, fading into foothills. That the mountains form a range is important. The feet of the mountains are joined. How separate the peaks actually are or, alternatively, represent the joint outcome of inferred tectonic processes become interesting questions. It is ties formed by social actors, advertising creatives who work together in teams, that suggest an approach to finding some answers. The systematic empirical data are provided by the credits in the TCC annual; heavy use is made of graphic imagery, especially network diagrams; and the mathematical and computational models incorporated in Pajek not only generate the diagrams, they also suggest a variety of ways to parse and explore the data.
A primary focus on relationships, ties between social actors, instead of actor attributes, is a feature cited by every introduction to social network analysis. Wasserman and Faust note four additional features frequently found in social network analyses.
• Actors and their actions are viewed as interdependent rather than independent, autonomous units.
• Relational ties (linkages) between actors are channels for transfer or ‘flow’ of resources (either material or nonmaterial).
• Network models focusing on individuals view the network structural environment as providing opportunities for or constraints on individual action.
• Network models conceptualize structure (social, economic, political, and so forth) as lasting patterns of relations among actors.(Wasserman and Faust, 2005 [1994]:4).
Thus, for example, in this study the actors, the advertising creatives, work together in teams. Team members bring different skill sets to the table, all of which are required to produce award-winning advertising. They are certainly interdependent. Working together in teams involves flows, minimally the exchange of ideas required to reach consensus on a proposal and produce the ad in question. Working in a team with other talented people presents opportunities; working with winning teams is a way to advance a career. Working in teams also involves constraints. Advertising creatives are notoriously independent thinkers, often prima donnas. But to work together successfully requires give and take and knowing how far to push without pushing too hard.
It is, however, an interesting question whether the actors who make up the teams form lasting relationships. Teams are formed for specific projects. Team members may go their separate ways once a project is over. Our data show us only that the members of a team worked together on one or more winning ads, and the networks constructed by contest judges decisions are only subsets of larger professional networks.
Mark Newman reminds us that, mathematically speaking, a network is simply a collection of points joined together in pairs by lines. (2010:1) In the case of social networks, the points represent actors, the lines the social ties between them. But precisely the same sort of representation can be used for all sorts of networks: the Internet and Worldwide Web, transport and power grids, and protein cascades in cell biology are frequently cited examples. Why, then, a reader might ask, turn to network analysis for help in understanding systems in which so much else are involved? Why, in particular, use network analysis to study people, whose feelings, thoughts and meanings are not represented in network diagrams? One answer is that all these can added to the framework that network analysis provides, as the overall plan for this research suggests. Newman provides another, and to me compelling, answer.
Scientists in a wide variety of fields have, over the years, developed an extensive set of tools?\mathematical, computational, and statistical?\for analyzing, modeling and understanding networks?c. Thus if there is a system you are interested in, and it can usefully be represented as a network, then there are hundreds of different tools out there, already developed and well understood, that you can immediately apply to the analysis of your system. Certainly not all of them will give useful results?\which measurements or calculations are useful for a particular system depends on what the system is and does and on what specific questions you are trying to answer about it. Still, if you have a well-posed question about a networked system there will, in many cases, already be a tool available that will help you address it. (2010: 2-3)
For this particular project, Pajek provides a handy toolkit in which many useful tools can be found. There is, however, one additional set of issues to consider about the way in which those tools are used.
Wasserman and Faust note that, “the methods of social network analysis can be used in two ways, as formal descriptions or in model and theory evaluation and testing.” (2005[1994]:5). Here I would like to suggest a third. The formal descriptions and network diagrams generated by Pajek and similar software can function, in effect, as the social scientist’s microscope. Like the biologist’s microscope, they reveal fine details of structure that are normally invisible or only dimly perceived. This simile gains added force from network visualization software’s use of color, shape and size to code network node attributes (as, for example, assigning a color that indicates the lead agency in charge of producing an ad or making actors with more direct connections to others visibly larger than others). These capabilities allow this network analyst to follow the biologist’s example and stain his slides to highlight structures of particular interest. Other tools make it possible to dissect complex structures and extract portions of them that are simpler to understand. The formal descriptions provide a richly detailed structural framework on which to hang other considerations, from personal perspectives to material conditions.
This point, however, marks the boundary of this study. Model and theory evaluation and testing require mathematical and computational expertise that others will have to supply.
Winners' Circles (Getting Started with Network Analysis)
Categories:
This section describes how I began my shift from metaphor to method in my use of network analysis. It describes a variety of sources and offers a few pointers for others who might wish to follow this path.
When this research began, my knowledge of network analysis was rudimentary. I had seen some network diagrams and vaguely imagined that my credits data from the TCC annual could be made to look like that. Thus, while designing the database and arranging for the data to be input, I was also trying to teach myself a new academic discipline. The progress reported here remains at an elementary level. I have a better idea now of things that might be done; but what has been done so far is, truth be told, still very basic, indeed.
Step one was to read some popular books on the subject: Duncan Watts (2003) Six Degrees: The Science of a Connected Age and Albert-Lazlo Barabasi (2003) Linked: How Everything is Connected to Everything Else, for example. These books taught me that social network analysis is a subset of a larger field called network analysis, whose mathematical principles apply to transportation and power grids, the Internet and protein cascades as well as social networks. That was exciting. But while books in this genre were good for pumping up my interest, they didn’t teach me how to do network analysis.
An old friend, sociologist James Ennis put me on to UCINET, academia’s most widely used social network analysis software, and searching the Web to learn more about that program brought me to Robert Hanneman and Mark Riddle (2005) Introduction to Social Network Methods (available online at http://www.faculty.ucr.edu/~hanneman/nettext/). This text whetted my appetite but was plainly designed for students with professors handy to answer their questions. As an independent scholar, I was, or so it felt to me, left working out too much for myself by trial-and-error.
Pursuing other leads brought me to Stanley Wasserman and Katherine Faust (2005 [1994]), Social Network Analysis: Methods and Applications, a frequently cited work that provides a very thorough grounding in the mathematics of network analysis and its application to social networks?\and is tough going for a newcomer who is still trying to resurrect what he learned in undergraduate courses in logic, calculus and probability. I ran into a similar problem when I purchased a copy of Mark Newman, Albert-Lazlo Barabasi, and Duncan J. Watts (2006) The Structure and Dynamics of Networks.This collection of classic papers is a deep introduction to the history of network analysis and nicely complements Lin Freeman (2004) The Development of Social Network Analysis: A Study in the Sociology of Science, which provides a wealth of the human detail concealed in more abstract introductions to the field. That said, it, too, is tough sledding for a beginner unfamiliar with the relevant mathematics.
Today getting started is easier than it was even just three years ago. Newcomers to the field can start with Alexandra Marin and Barry Wellman (2009) “Social Network Analysis: An Introduction” forthcoming in the SAGE Handbook of Social Network Analysis. The year 2010 also saw the publication of three new textbooks that target advanced undergraduates and graduate students taking a first or second course in network analysis: David Easley and Jon Kleinberg (2010) Networks, Crowds, and Markets: Reasoning About a Highly Connected World, Matthew O. Jackson (2010) Social and Economic Networks, and M. E. J (Mark) Newman (2010) Networks: An Introduction. All are written by masters in the field and are relatively accessible to readers whose math is at my recovering undergraduate level. I would still, however, need to learn not only basic network concepts but also how to use a software package to analyze my data.
The book that turned my life around and made this research possible is W. de Nooy, A. Mrvar, and V. Batagelj (2005) Exploratory Social Network Analysis with Pajek, a book that lives up to the promise of its blurb and is, in fact, ” the first textbook on social network analysis integrating theory, applications, and professional software.” The concepts used in my research were, if not first encountered, first understood, at least in part, by working through this book. For an independent scholar there was also the added advantage that Pajek, written and updated by Andrew Mrvar and Vladimir Batagelj and their colleagues at the University of Ljubljana, is freeware and easily handles networks with thousands of nodes.
Winners' Circles (Designing the Database)
Getting down to the nitty-gritty. If you need a quick introduction to the basic principles of database design, this is the place to look.
The database in which the credits data used in the social network analysis are stored was developed in Filemaker Pro. In Filemaker Pro the data are stored in tables and displayed and manipulated in layouts in which data from multiple, related tables can be combined. This database has three primary tables: Ad, Creator, and Role, which currently contain information from the TCC annuals from 1981, 1986, 1991, 1996, 2001, 2006, and 2007. In total the database contains records on 4536 ads, 8579 creators, and 34907 roles linking creators with ads.
But why these three tables, and how do they function? The following discussion is a bit technical but deserves close attention from readers who wish to know how the analysis reported here was done as well as the conclusions drawn from it. It may also be useful for those contemplating similar research to know that working out these details took me several months of intermittent hacking before I got them clear.
In this type of database, the data are stored in fields, with the fields referring to a single case combined in a single record. To readers familiar with spreadsheets, it suffices to say that if a table is represented in spreadsheet format the fields are the the columns; the cases are the rows. But why, in this database are three separate tables required?
It is a basic principle of database design that there are three and only three fundamental relationships between the data contained in separate fields: one-to-one, one-to-many, or many-to-many. If the relationship is one-to-one, the two fields can be combined in a single table. If the relationship is one-to-many, two tables are required, with a unique identifier that appears in both tables used to link one to the other. If the relationship is many-to-many, three tables are required. Two of the tables have a one-to-many relationship to the third, called the join table, that provides a bridge between them. To see how this works in practice, we now take a closer look at the data contained in the Ad, Creator, and Record tables.
Each ad that appears in the TCC annual is a unique case, with several attributes, each of which stands in a one-to-one relationship with the ad in question. Each ad has only one sponsor, one lead agency, one industry category, one year and one medium. These basic items all appear with the ad in its record in the Ad table. Calculation fields (a special kind of field that displays the result of a calculation) are used to code the raw data in the basic fields; so that, for example, ad agencies can be coded as Dentsu=1, Hakuhodo=2, ADK=3, and Other=4.
Each creator has a personal name and surname. But here we have a problem. Different individuals may have the same names. The solution is to assign each creator a unique serial number. A calculation field is used to combine the first three letters of the surname with the serial number to create the name used in the social network analysis. Thus, for example, a copywriter named Maki Jun (where “Maki” is the surname and “Jun” the personal name), whose unique serial number is 65, becomes Mak65.
While calculation fields are used for coding information in both the Ad and Creator tables, the basic one-to-one relationship between the fields in each table remains undisturbed. In the Role table, which functions as a join table and provides links between ads and creators, things are a bit more complicated.
The problem here is that creators and ads have many-to-many relationships. The same creator may be credited with several different roles in the production of an ad: the same individual may, for example, have played three roles, creative director, copywriter, and planner. In addition, two or more individuals may be credited with the same role: thus, for example, multiple copywriters may have worked on the same ad. Records in the Role table each contain three vital pieces of information: a unique identifier for an ad; a unique identifier for a creator; and a category label for the type of role in question: copywriter, art director or film director, for example.The unique identifiers are automatically generated serial numbers assigned when new ads or creators are added to the database, and the pair of unique identifiers specify precisely the particular role in question. It is the roles specified in this way, as unique combinations of ad and creator that become the links analyzed by the social network analysis software.
In sum, the ads and creators are nodes in the networks analyzed. The roles are the links which connect them.
Winners' Circles (Assembling the Data)
Where did the data for this research come from? What are the sources and how were they used? These are basic scientific and scholarly questions for which this section begins to provide some answers.
Anyone who studies the Japanese advertising industry confronts mountains of data. Like the field geologist confronting a range of real mountains, he will not be able to disassemble and analyze the whole range. Question No. 1 is what and where to sample. The samples, moreover, are bound to be incomplete. This research makes use of archival data; but archival records are, in fact, like geological strata, sometimes twisted or broken in ways that leave gaps in the record.
One possible approach would be to explore the trade press that has, in some cases, covered the Japanese advertising industry for a half century or more. Sendenkaigi, a monthly magazine devoted to “marketing and creativity” started publication in 1954, the same year that the ADC was founded. Sendenkaigisha, its publisher, now publishes a variety of similar periodicals that target advertisers, designers, sales promotion and PR experts, and editorial writers. Koukoku Hihyou (Advertising Critique), which ceased publication in 2010 after a forty-year run, aimed to provide a critical (but supportive) perspective on the relation of advertising to mass culture. Business periodicals like those published by Nikkei Shimbunsha (the publisher of the Nikkei Shimbun, Japan’s equivalent to the Wall Street Journal) might also be consulted. The Nikkei Advertising Research Institute’s annual white paper is a source of which heavy use is made in this research. And of books about Japanese advertising, both single-author and collections, there seems to be no end. All of these sources need to be used with care, since changes in format and editorial policy may have altered the types of information they provide. When, for example, I first subscribed to Sendenkaigisha’s Brain magazine, its focus was market research. The current incarnation of Brain covers advertising art and design. We shall return to these issues in Part II, when we look more closely at the historical context of the trends revealed by the social network analysis.
The data for the social network analysis reported here are taken from the Tokyo Copywriters Club Advertising Annual. This annual is not the only publication of its kind. The the first edition of this annual was published in 1963, the year in which theTokyo Copywriters Club (TCC) was founded. The Tokyo Art Directors Club (ADC) was founded nearly a decade earlier, in 1954, and it, too, publishes its own annual. The All Japan Radio & Television Commercial Confederation (ACC) annual, which contains the results of the yearly ACC CM Festival and has been published continuously for forty-five years. All three annuals provide credits data like that used here. There is much overlap between them but also differences. To choose to use data from one instead of the others is, thus, to adopt a particular perspective on the industry as a whole.
The author’s choice to use data from the TCC annual is, like much anthropological research, opportunistic. He became acquainted with this annual while working as a copywriter, used it as primary source material while teaching, and acquired the collection of recent volumes whose perusal inspired the research reported in this book. Other perspectives will be considered, but the research reported here is focused primarily on the world of Japanese advertising as seen by those who, like the author, has pursued careers as copywriters and creative directors.
The reader should also be aware that, while the TCC annual has been published continuously since 1963, the data reported here are only from the 1981, 1986, 1991, 1996, 2001, and 2006 annuals. Why not all of the data since 1963 and why these particular years? The author’s collection of these annuals includes a continuous series starting in 1979. His collection of the earlier volumes is incomplete. It would, of course, be desirable to have data from all of the available volumes in the database; but since the data must be transferred manually from the printed pages of the annuals to the database, the expense in both time and money prohibited this choice. Data from the 2001 annual were used while designing and testing the database, and the decision to cover three decades at five-year intervals resulted in the years indicated above.
Winners' Circles (Why Social Network Analysis?)
In this section of the introduction, I talk about how social network analysis became the focus of this project.
My first encounter with social network analysis was in the late 1960s, while still a graduate student at Cornell. I no longer remember precisely whose work I was reading. It does seem likely, however, that it had to do with the Rhodes-Livingstone Institute research in Central Africa directed by J. Clyde Mitchell. Mitchell’s students were all involved, in one way or another, in studies of individuals who had migrated from tribal homelands to cities in search of employment opportunities. In this new setting, their behavior could no longer be attributed solely to the implications of tribal institutions. How they formed ties and interacted with co-workers from other tribes as well as their own had to be considered. According to Lin Freeman’s history of social network analysis, it was Mitchell who recognized that a series of studies on superficially different topics shared this structural core (Freeman, 2004:4).
At this point, however, I was unaware of social psychologist Jacob Moreno’s work in the early 1930s on small group dynamics and his invention of Sociometry, the identification of social stars and later key opinion leaders whose interest becomes the tipping point at which new trends take off. I was also unaware of developments in graph theory, the branch of mathematics on which network analysis tools are based. As I then imgined it, social network analysis was, in effect, synonymous with the study of what sociologists call “informal organization,” social relationships that escape the boundaries of formal organizational structures. It may have been some notion of the importance of informal relationships that led to my seeing Chinese ritual as more about establishing and manipulating relationships than simply affirming corporate group or territorial boundaries. At this stage, however, my use of the concept of social network analysis was only metaphorical. It was neither empirically grounded nor solidly quantified.
In any case, interest in social network analysis receded into the background and became a path not taken until 2007, when casting about for a new research project, I noticed that, while teaching a seminar on the making and meaning of advertising at Sophia University, I had acquired a small collection of recent volumes of the TCC?L???R?s?[?N?? (TCC koukokukopii nenkan, Tokyo Copywriters Club Advertising Copy Annual). The annual, published every year since 1963, contains the output from the club’s annual ad contest. Every year, several thousand pieces of advertising are submitted as entries to the contest. About ten percent of the entries make it into the annual, divided into roughly a dozen industrial categories (the exact number of categories has changed a bit over the years). Each and every ad in the annual comes with a set of credits that list not only the medium in which the ad appeared, its sponsor and the agency and/or production houses that paid for and produced the ad but also the names of the individuals who made up the team that created the ad and the roles for which they are given credits. It occurred to me that if the credits were put in a database, I could use social network analysis to see which individuals worked together in winning teams, identify key figures and trace their careers over time. I could also map how how their relationships changed over time and explore how these changes reflected the development and overall structure of the industry. I would have a solid framework on which to hang historical and ethnographic data.
Thus it was that an overall plan for the project took shape. It would start by creating a database for the credits data, studying social network analysis and learning available software. Meanwhile, on a separate track, loomed another task. The key figures in the networks examined in this are often authors in their own right. They have written or contributed chapters to books in which they expound their views of how advertising works, what makes a good idea, what goes into a good presentation, how the work should be produced, team-building or leadership. They are also frequently interviewed in an active trade press, asked to comment on current topics of interest to the industry. The publications in question produce hundreds of pages each month and are available in series that go back for half a century or more. For this part of the task, the anthropologist would have to be an historian and had a lot of work to do. Finally, there was the holy grail. Having done the social network and historical analysis, the ethnographer might be able to interview some of the people in question, to hear what they had to say, to correct or add to his findings.
Winners' Circles (The Anthropological Observer)
The previous post addressed the influence on the author of being a participant in the industry he is studying. Here the focus shifts to his academic training as an anthropologist and how that is reflected in the structure of the book.
The anthropologist who peers over the shoulder of the adman in me is the product of late 1960s graduate training in anthropology at Cornell University and two trips to Taiwan (1969-71 for dissertation fieldwork; 1976-77 for advanced training in Chinese). It was during the first of the trips to Taiwan that I was asked the question to which this book is my latest answer.
Clancy Engler, the Maryknoll missionary who was priest of the local Catholic parish in Puli, where my fieldwork was based, had been in Taiwan for fifteen years and spoke Taiwanese like a native. The first time he asked me, “What can an anthropologist teach someone like me?” I had no ready answer. It seemed absurd to imagine that a fresh-off-the-plane, green behind the ears, just starting to learn Taiwanese young anthropologist like me would ever have anything to teach an old hand like him.
A year later, I had an answer. I could point out a few things about Taiwanese ritual of which Clancy was unaware. I had had the extraordinary privilege of spending a whole year with no other obligation than to talk to people and look for answers to whatever questions occurred to me?\and more important here, my training as an anthropologist had given me questions to ask that had never occurred to a priest busy running his parish.
The late 1960s were an exciting time to be a novice anthropologist. All sorts of new ideas were in the air. I was excited by Claude Lévi-Strauss’ advice in the “Overture” to The Raw and the Cooked to look for the logic in tangible qualities (that later would help the adman a lot when it came to talking with art directors). Mary Douglas’ Purity and Danger epitomized a renewed focus on social and cosmological categories and, in particular, on people and things that fall in the cracks between them (which later resonated a lot with my advertising colleague’s rule-breaking habits and endless search for something new). I was persuaded by Clifford Geertz that ethnographers should strive to produce “thick descriptions”(1973:3-30). I was particularly impressed by the opening paragraph of Geertz’s essay “The Impact of the Concept of Culture on the Concept of Man.”
Toward the end of his recent study of the ideas used by tribal peoples, La Pensée Sauvage, the French anthropologist Lévi-Strauss remarks that scientific explanation does not consist, as we have been led to imagine, in the reduction of the complex to the simple. Rather, it consists, he says, in a substitution of a complexity more intelligible for one which is less. So far as the study of man is concerned, one may go even further, I think, and argue that explanation often consists of substituting complex pictures for simple ones while striving somehow to retain the persuasive clarity that went with the simple ones. (1973:33).
Geertz’s amendment of Lévi-Strauss is a fair amendment of what this book strives to be. It substitutes complex pictures of Japan’s advertising industry for the simple ones with which it begins. The research it describes begins with a simple visual image of a range of mountains that captures a bit of commonsense knowledge about the industry’s overall shape. The research uses scientific tools to analyze the structures that underly the topography and the processes that have led to their formation. It also employs interpretive, historical and ethnographic methods to explore what the history revealed by the scientific analysis meant to some of the key figures involved in making that history.
But reader be warned: neither science nor interpretation can claim to be a complete account. Japan’s advertising industry is a very large and complex business. An active trade press, government and private researchers have been generating data about the industry ever since the 1950s. This data stream is a river flowing into an ocean where it mingles with other political, economic, and cultural information. The picture presented here will be complex but it remains at best a cartoon. Those who wish to learn more or to challenge its depictions will have plenty of work to do.
::::::::
Geertz persuaded me that ethnography should produce thick descriptions. The only problem was that he never explained how to do it. It was my good fortune, however, to spend a year at Cornell while the British anthropologist Victor Turner was teaching there. Turner remains to this day my model of how a great fieldworker goes about his research.
Turner was British, and like other British anthropologists, was trained in social anthropology, regarded back then as the branch of sociology that studies people who lived outside Europe and North America, where the rest of sociology conducted its research. A former Communist turned Catholic and a member of the Manchester School, he was deeply immersed in Marxist theory and, it now seems to me, conceived of his research paradigm in terms of infrastructure (production and reproduction) and superstructure (ideas, religion, art, theater). Thus, his research began with sociological fundamentals: demography, village maps and house diagrams, kinship, marriage, property, inheritance and succession to office. These would be synthesized in an overview of social structure and process that would frame his research on more cultural topics: rituals, symbols, social dramas and the role of performance in social life. He taught his students that we begin with social structure and process, to which we add what we see (our own observations) and what we hear (the native exegesis, what the people whose lives we study tell us). None, he insisted, are the answer to the ethnographical puzzle. All are pieces that go into the final picture.
Turner’s model defines the structure of this book. Following this introduction, Part I will present the results of social network analysis of the credits associated with the ads that appear in the 1981, 1986, 1991, 1996, 2001 and 2006 editions of the Tokyo Copywriters Club Advertising Copy Annual. This analysis shows us who worked with whom as members of the teams whose ads won places in these volumes. It allows us to identify key figures in the networks that connect the members of these teams and to trace several distinguished careers over the decades covered by these data. It also reveals the impact on both networks and teams of fluctuations in Japan’s economy and, on the media side, of the rise of TV and decline of print media during the period in question. Part II begins by recounting the history of a long and sometimes heated debate over what the roles of copy in advertising and of copywriters in producing advertising should be. I concludes with extracts from conversations with several of the key figures identified by the network analysis, to explore how they see this debate and the ways in which the industry has changed over the years in which they have worked in it. The conclusion pulls together what we have learned, examines the limitations of the study in terms of both data and method, and suggests directions in which similar research might be improved.
Winners' Circles (The Frog in the Well)
The next bit of writing for Winners’ Circles, the book I am working on. It describes the advertising industry participant’s perspective I bring to the book.
When I followed my wife Ruth to Japan in September 1980, I was an unemployed anthropologist. Ruth had followed me to Taiwan for my dissertation research, so it seemed only fair that, when she, who was studying Japanese literature, got her fellowship for a year at the Interuniversity Center in Tokyo, I would follow her to Japan. Besides, our daughter was four, and we didn’t want to break up the family. Having spent the previous year working as a research assistant in the Yale Computer Science Department’s AI Project made me more knowledgeable than most about digital technology at a time when Japanese high-tech companies were starting to flood the world’s markets with electronic typewriters, PBXs, PCs and dot-matrix and laser printers, copiers and fax machines. That, and a connection provided by one of Ruth’s colleagues, got me a job with a small corporate communications company that led, three years later, to my being hired by Hakuhodo to write English copy for export advertising. A few years later, I was part of the team that produced the pan-European launch of a new autofocus camera system, having won a competitive pitch against several European agencies. Following that break, I was promoted to “International Creative Director” and began carving out a niche helping my Japanese colleagues present their work on domestic campaigns to international clients headquartered outside Japan.
I mention all this because, while I was trained as an anthropologist and had done fieldwork in Taiwan, I was not doing fieldwork while working at Hakuhodo or later, after leaving the agency, as Ruth’s partner in our company The Word Works (http://www.wordworks.jp). I was busy with whatever the workday demanded and never got around to the systematic research that fieldwork entails. Thus, when I offer anecdotes based on my own experience, I am at best an informed informant, informed in the sense that I have some idea of what that other me, the anthropologist, is looking for. The social network analysis of archival materials, historical research and interviews with industry figures that make up the bulk of this book are essential grounding for arguments for which my haphazard memories are, by themselves, too weak a support.
That said, there are a few anecdotes that should be told because the incidents in question have shaped my interpretations of the other evidence the book contains?\at least as much, I suspect, as the academic ideas that have gone into its construction.
I vividly recall Kazuhiko Kimoto, the senior creative director who had given me my job at Hakuhodo, swearing after six months or so that he would never, ever hire another academic. To put the matter bluntly, my writing was still pedestrian; I would still get lost in the technical details of the products for which I was writing advertising and fail to extract a compelling story and squeeze it into the space allotted for the ad in question. Fortunately, Kimoto never tired of providing the verbal whacks on the head that eventually led, Zen-like, to enlightenment and the realization that deciding what to say (never everything; there was never room for that) and how to say it (to seduce instead of bludgeoning the reader) were essential aspects of the trade into which I had stumbled. There are other ways to craft effective advertising; but, working with Kimoto, I learned the art of isolating a critical detail in a product and constructing a story about it that would fit the client’s image of what the client wanted to communicate.
Thus, for example, the first of my ads to win a prize in a local English-language advertising contest was written to publicize the client’s introduction of a new printing technology for its line of electronic typewriters. The technical point was a mechanism that ensured that in every line typed the characters would be perfectly even. Having started business as a camera manufacturer, the client was obsessed with image quality. The winning headline read, “We put our reputation on every line.” Another example was a small print ad for a concert program. The client was a tire manufacturer that sponsored a Japanese youth orchestra concert at Carnegie Hall. Leafing through the client’s annual report, I noticed a picture of an airliner touching down on a runway. Any chance, I asked the account executives, that the airliner that carries the orchestra to New York land on the client’s tires? Their “Yes” led to our using the picture I’d discovered and my adding the headline,“Another way [the tire manufacturer] supports the arts.”
I also recall two conversations with Kimoto. One occurred at a time when the agency was making one of its periodic efforts to make people in the creative division conform to company work rules, i.e., show up and go home on time. Kimoto told me, “There is only one rule. If the agency gets business because you are here, you can ignore the other rules.” During the second conversation we were talking about the way in which young non-Japanese (yes, I was still very young then) would demand greater responsibility for the work they were doing. Kimoto remarked, “Look around you. This is a big company, and there is more responsibility to be taken than there are people willing to take it. Don’t try to do what somebody else is already doing. Find something that ought to be done that no one else is doing?\and just do it.” The result would be, he said, that within three months you would be the person in charge of doing whatever that was. He was right.
These interactions and conversations made an indelible impression on me. In retrospect, I now realize that much of what I learned from Kazuhiko Kimoto was conventional wisdom ?\ the conventional wisdom, that is, of people whose job is to find critical details and construct compelling stories, people who are always looking for something new, something no one has done before, people who break rules to strengthen the impact of what they produce, people I admire as mentors and models, the individuals whose lives and works are the focus of this book.
Winners' Circles, A Work in Progress (Introduction)
After three years of preparation, John is finally getting started on writing up his Winners’ Circles research using social network analysis to drive ethnographic and historical research on the advertising creatives whose ads have been published in the Tokyo Copywriters Club Advertising Annual. I will be using this blog to post drafts of material intended for inclusion in the book whose writing is now in progress. For example, the following introduction…
This book lies at the intersection of one life and three perspectives. For thirty years I have worked in and around the advertising industry in Japan, for thirteen of those years as an English-language copywriter for Hakuhodo, Inc., Japan’s second-largest advertising agency. While working at Hakuhodo, I acquired a narrow understanding of how export advertising is made in Japan and developed a desire to know more about the Japanese advertising industry and the world of my Japanese colleagues who create advertising for Japan’s domestic market.
I am also an anthropologist, whose fieldwork in Taiwan led to a dissertation on the symbolism of Daoist magic. My participant’s desire for a broader understanding of the advertising world in Japan has stimulated my thinking about how to extend ethnography?\the anthropologist’s face-to-face encounter with those whose lives he studies?\to do research on a multi-billion dollar industry that employs thousands of individuals, who are, at any one moment, working on hundreds of projects in multiple media that are, themselves, continually evolving. The approach I’ve adopted here is to combine personal experience, interviews with key industry figures, and historical research based on trade publications?\with the use of new scientific tools for social network analysis.
Putting together the results of these various forms of research has led to consideration of philosophical issues that divide researchers across the full spectrum of social sciences and humanities, pitting those who favor quantitative analysis and computational modeling on the one hand against those who insist that research on human beings requires a qualitative, interpretive approach. After a long intellectual journey that began with growing up in a deeply religious household and has led through philosophy and history of science to anthropology and advertising, I find myself straddling the two sides of this argument. My position, as of this moment, is that all anthropology is at the end of the day like archeology, an attempt to assemble convincing stories from fragmentary data and should, thus, wherever possible include scientific analysis. Those who work in advertising may also see similarities to a process that attempts to meld marketing research and creative inspiration into compelling business propositions.
The result is a book that readers with different interests may read in different ways. Some will have a particular interest in Japanese advertising. Here they will find a history of Japanese advertising with a particular focus on the 1980s, 90s and naughts, a period that saw the rise of TV and the decline of newspapers as Japan’s major advertising medium. The thematic focus will be on advertising copy and the role of the copywriters who produce it. Others may start with a broader interest in advertising per se or in advertising’s role as one of the “culture industries” that produce media content and shape the public imagination. They may find it interesting to learn that the Japanese advertising industry differs in organizational structure and approaches to handling clients from its counterparts in North America and Europe. A few may wish to pursue the scholarly issues raised. For them the book’s success or failure will turn on how well it succeeds in extending ethnography and incorporating both quantitative and interpretive approaches to the data it considers.